Roast Curves 101: The Chart That Makes Your Coffee Taste Amazing
Listen while you browse:
Google's Deep Dive Podcast on The Chart That Makes Your Coffee Taste Amazing
The Squiggly Line to Delicious Coffee
Ever wondered why your favorite Biodynamic and Melk organic coffees tastes identical bag after bag? It all starts with a squiggly line on our Cropster screen called a roast curve. Today we're decoding that line—so the next time you sip Holistic Roasters coffee, you'll know exactly how the magic happens.

The Quick Scoop
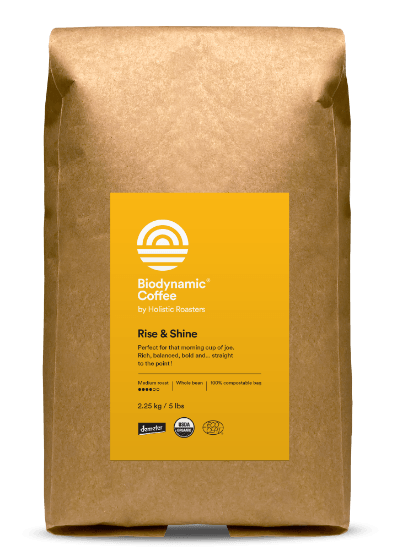
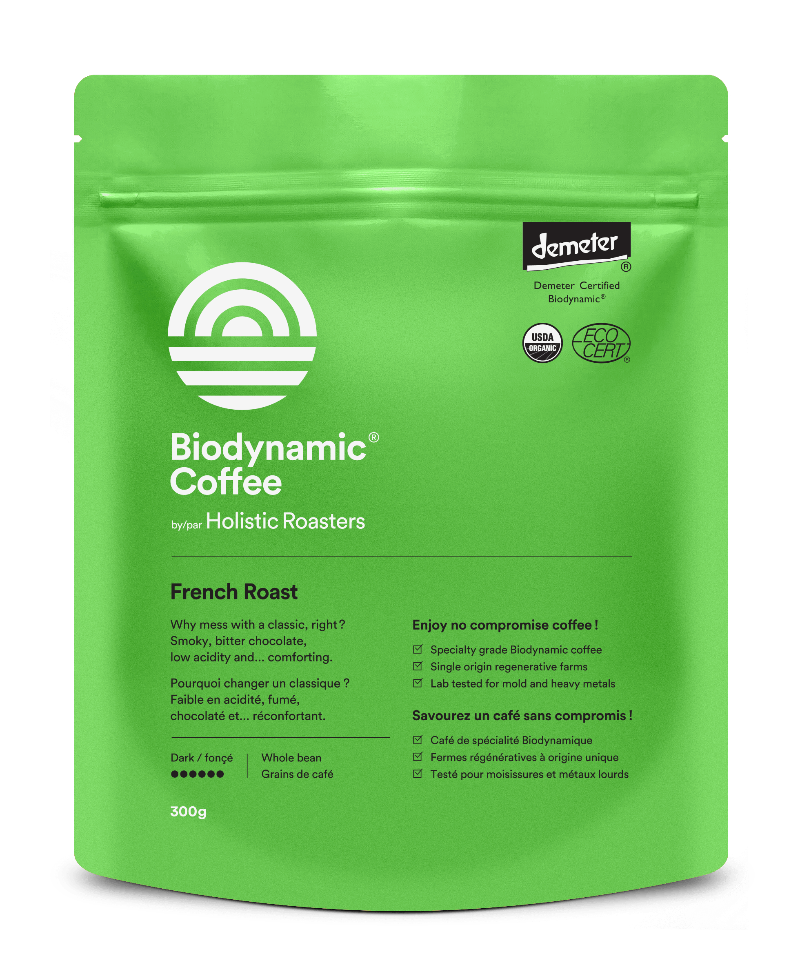
A roast curve is the temperature graph that guides our roasting process from start to finish. By tracking bean temperature, exhaust temperature, and rate of rise, we ensure every bag of Holistic Roasters coffee delivers the same exceptional flavor profile. The curve's shape directly impacts what you taste—from the caramel sweetness in Rise & Shine Medium Roast to the dark chocolate notes in our French Roast.
Meet the Three Lines That Matter
When you peek over a roaster's shoulder at their laptop screen, you'll see a graph with three crucial lines. Each tells a different part of the story happening inside our Probat P25 drum roaster.
The Roast Curve
| Curve | What It Measures | Why It Matters for Flavor |
|---|---|---|
| Bean Temperature (BT) | The actual temperature of the beans—plotted in blue. | A steady rise promotes even development and sweetness. |
| Exhaust Temperature (ET) | The air temperature in the drum—plotted in red. | Reacts fast to gas changes and helps us predict where BT is headed. |
| Rate of Rise (RoR) | How quickly BT is increasing, shown as a descending curve. | We aim for a gentle downhill slope; sudden spikes ("flicks") or dives ("crashes") lead to harsh or flat cups. |
Did You Know?
ET's RoR roller-coasters after every gas tweak, giving us a heads-up on where BT's RoR will go next. Think of it as a spoiler alert for bean temperature. This preview helps our roasters make micro-adjustments for perfect flavor development.
The Five Phases Your Beans Travel Through
From green to your perfect cup, coffee beans journey through distinct phases during roasting. Each phase develops different flavor compounds and contributes to the final taste profile.
Drying
Green beans release moisture; grassy aromas fade
Color Change
Beans turn yellow to tan; early toast notes emerge
Maillard Reaction
Sugars caramelize, building body and sweetness
First Crack
Beans pop like popcorn; light-roast territory begins
Second Crack
Oils surface on beans; smoky depth emerges (dark roasts only)
Development Time Ratio: The Flavor Dial
From the first pop of first crack until drop time, we watch a metric called Development Time Ratio (DTR)—the percentage of total roast time devoted to flavor development. This single number is crucial for achieving consistent flavor profiles.
Filter Coffee DTR
16–21% development time ratio creates bright, nuanced cups that showcase origin characteristics. Perfect for pour-over, drip, and other filter brewing methods.
Espresso DTR
20–26% development time ratio balances acidity with body and sweetness for exceptional espresso extraction without harsh notes or sourness.
Dark Roast DTR
25–30% development time ratio builds deep caramelization and body with reduced acidity, ideal for dark roast lovers and milk-based drinks.
Try it Yourself!

Ready to dive deeper into the art of roasting? Use our free Coffee Roasting Simulator to experiment with curves, master your technique, and see how each decision shapes the final cup with AI feedback on your roast.
Case Study: Minivan
For our popular Minivan blend, we target 418–425°F bean temperature and a 20–26% DTR. Hitting the bean temperature first but not the DTR? We keep roasting. DTR first but bean temperature only 410°F? We keep roasting. Only when both align do we drop the batch, ensuring perfect consistency cup after cup.
Why the Curve's Shape Dictates Taste
The shape of your roast curve is directly correlated with what you'll taste in the cup. Even subtle variations can dramatically alter flavor—which is why we obsess over every detail of that squiggly line.
Smooth, Gradually Declining RoR
How it looks: The Rate of Rise line gently slopes downward throughout the roast, creating a beautiful arc without sudden changes.
What you'll taste: Round sweetness, balanced acidity, clear flavor notes, and excellent mouthfeel. This is the ideal curve we aim for in our Rise & Shine Medium Roast—creating that honeyed sweetness you love.
Flat-Lined RoR
How it looks: The Rate of Rise line remains completely horizontal for an extended period instead of gradually declining.
What you'll taste: Scorched exterior but under-developed core—creating a disjointed cup with harsh edges but lacking depth. The beans cook unevenly, resulting in mixed roast levels within the same batch.
RoR Flick Near Drop
How it looks: The Rate of Rise suddenly spikes upward near the end of the roast after declining normally.
What you'll taste: An acrid spike of acidity that disrupts the cup's balance. This sudden acceleration of heat in the final moments creates unpleasant sharpness that dominates the flavor profile.
RoR Crash Mid-Roast
How it looks: The Rate of Rise suddenly drops dramatically in the middle stages of the roast.
What you'll taste: Baked, cardboard notes with muted acidity and flat sweetness. This "stalling" of the roast creates a dull cup lacking vibrancy and clarity—coffee that tastes like the paper filter it was brewed through.
How This Shows Up in Your Cup
The theoretical impact of roast curves becomes deliciously real when you taste our different coffees. Each has been roasted with a specific curve profile to bring out distinct flavor characteristics.
| Coffee | Curve Highlights | In-Cup Experience |
|---|---|---|
| Rise & Shine | Gentle RoR taper, drop at 22% DTR | Honeyed sweetness, silky body, caramel notes with subtle brightness |
| French Roast | Longer Maillard, second-crack finish | Dark chocolate, smoky depth, low acidity, bold presence |
| Minivan | Tight RoR control to prevent "flick" | Dense crema, candied-nut finish, excellent extraction stability |
Customize Your Experience with Bean Temperature
If you're interested in experiencing how bean temperature affects flavor, try our core offerings:
- Rubicon (380-400°F): Bright acidity, floral notes, tea-like body
- Rise & Shine (410-425°F): Balanced sweetness, caramel notes, silky body
- French Roast (435-445°F): Bold chocolate, smoky depth, low acidity
Each represents a different point on the roast curve, allowing you to find your perfect temperature preference.
Home-Barista Takeaways
Even without professional roasting equipment, understanding roast curves can improve your coffee experience. Here's how to make the most of expertly roasted beans:
Respect the Rest
Even with elite curves, beans still need 5-10 days post-roast to de-gas. This rest period allows carbon dioxide to escape and flavors to fully develop. Check the roast date on your Holistic Roasters bag for optimal brewing timing.
Adjust Your Grind
Lighter-curve coffees need a finer grind; darker curves like French Roast prefer coarser settings. This is because different roast levels create different bean density and solubility, requiring adjusted extraction approaches.
Storage Matters
Oxygen flattens that carefully shaped curve's hard-won complexity—store beans in a sealed, opaque container away from light, heat, and moisture to preserve the roaster's intended flavor profile.
Frequently Asked Questions About Roast Curves
We use specialized temperature probes placed at strategic points inside our Probat P25 drum roaster. The bean temperature probe (BT) extends into the bean mass itself, while the environmental temperature probe (ET) measures the hot air surrounding the beans. Both feed data to our Cropster software in real-time, updating the curve every second for precise monitoring and control.
Absolutely! At higher altitudes, water boils at lower temperatures, which affects both the drying phase and first crack timing. We adjust our target temperatures and development times based on our elevation to ensure consistent results. Similarly, beans grown at higher altitudes typically have denser structure, requiring slightly modified roast profiles to fully develop their flavor potential.
Different origins require tailored curves based on bean density, moisture content, and cellular structure. For example:
- Ethiopian beans often need gentler initial heat to preserve delicate floral notes
- Brazilian beans typically benefit from more aggressive early heat application
- Indonesian beans may require longer development time to tame their earthy characteristics
We maintain a database of successful curves for each origin we roast, allowing us to predict optimal profiles for new crop arrivals.
While we don't currently print roast curves on our packaging, we're working on a QR code system that will allow customers to view the exact curve of their specific batch online. In the meantime, you can email us your batch number (found on the bag), and we'd be happy to send you the roast curve data for your coffee.
Ambient temperature and humidity significantly impact roast dynamics. During cold winters, our roaster takes longer to heat up, and beans absorb heat differently. In summer, everything moves faster. We adjust our gas application, airflow, and charge temperatures seasonally to compensate for these environmental factors, ensuring your Rise & Shine tastes the same in December as it does in July.
Ready to Taste the Curve?
Experience the roast curve in your mug with Biodynamic and Melk organic coffees. Each sip represents our meticulous attention to temperature control and development time, resulting in consistently excellent coffee.
Use code CURVEMASTER for 10% off direct-to-door shipping.
Shop Holistic Roasters


